哈Ha
我遇到了一个Android应用程序的描述,该应用程序通过手机的摄像头(仅通过一般图片)确定心率。相机未安装在手指上,未通过LED点亮。有趣的一点是,审阅者不相信这种脉冲确定的可能性,因此该申请被拒绝。我不知道该程序的作者是如何结束的,但是检查这是否可能变得很有趣。
对于那些对发生的事情感兴趣的人,继续进行下去。
当然,我不会开发适用于Android的应用程序,用Python测试该想法要容易得多。
我们从相机接收数据
首先,我们需要从网络摄像头中获取一个流,为此我们将使用OpenCV。该代码是跨平台的,可以在Windows和Linux / OSX上运行。
import cv2
import io
import time


cap = cv2.VideoCapture(0)
cap.set(cv2.CAP_PROP_FRAME_WIDTH, 1920)
cap.set(cv2.CAP_PROP_FRAME_HEIGHT, 1080)
cap.set(cv2.CAP_PROP_FPS, 30)

while(True):
    ret, frame = cap.read()

    # Our operations on the frame come here
    img = cv2.cvtColor(frame, cv2.COLOR_BGR2GRAY)

    # Display the frame
    cv2.imshow('Crop', crop_img)
    if cv2.waitKey(1) & 0xFF == ord('q'):
        break

cap.release()
cv2.destroyAllWindows()
确定脉搏的想法是由于血管中的血液流动,肤色会略有变化,因此我们需要裁剪一幅图片,该图片仅包含皮肤的一部分。
x, y, w, h = 800, 500, 100, 100
crop_img = img[y:y + h, x:x + w]

cv2.imshow('Crop', crop_img)
如果一切都正确完成,则在启动程序时,我们应该从相机中获取类似信息(出于隐私原因而模糊)并裁剪:

治疗
, , . .
heartbeat_count = 128
heartbeat_values = [0]*heartbeat_count
heartbeat_times = [time.time()]*heartbeat_count

while True:
    ...
    # Update the list
    heartbeat_values = heartbeat_values[1:] + [np.average(crop_img)]
    heartbeat_times = heartbeat_times[1:] + [time.time()]
numpy.average , , .
:
fig = plt.figure()
ax = fig.add_subplot(111)
while(True):
    ...

    ax.plot(heartbeat_times, heartbeat_values)
    fig.canvas.draw()
    plot_img_np = np.fromstring(fig.canvas.tostring_rgb(), dtype=np.uint8, sep='')
    plot_img_np = plot_img_np.reshape(fig.canvas.get_width_height()[::-1] + (3,))
    plt.cla()

    cv2.imshow('Graph', plot_img_np)
: OpenCV numpy, matplotlib , numpy.fromstring.
.
, , , " ", - . - !
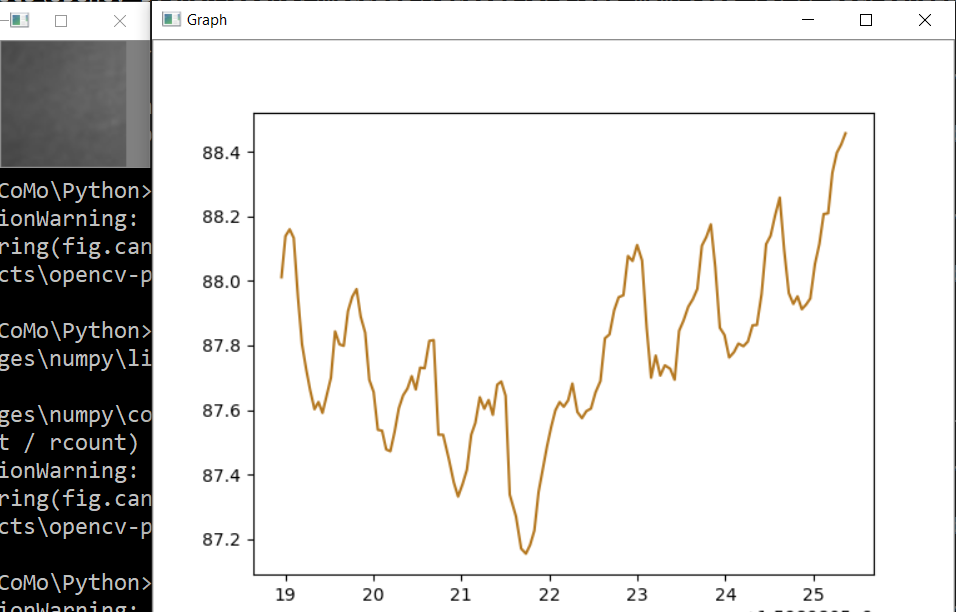
, , , . , ! , 0.5% , " ", . , , 75bpm. , :
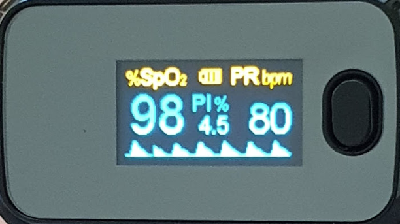
, .. , , .
, . , . , , OpenCV . , .
, - , ? , . cap = cv2.VideoCapture(0) cap = cv2.VideoCapture("video.mp4"), .
, .
Spoiler
import numpy as np
from matplotlib import pyplot as plt
import cv2
import io
import time

# Camera stream
cap = cv2.VideoCapture(0)
cap.set(cv2.CAP_PROP_FRAME_WIDTH, 1920)
cap.set(cv2.CAP_PROP_FRAME_HEIGHT, 1280)
cap.set(cv2.CAP_PROP_FPS, 30)
# Video stream (optional)
# cap = cv2.VideoCapture("videoplayback.mp4")

# Image crop
x, y, w, h = 800, 500, 100, 100
heartbeat_count = 128
heartbeat_values = [0]*heartbeat_count
heartbeat_times = [time.time()]*heartbeat_count

# Matplotlib graph surface
fig = plt.figure()
ax = fig.add_subplot(111)

while(True):
    # Capture frame-by-frame
    ret, frame = cap.read()

    # Our operations on the frame come here
    img = cv2.cvtColor(frame, cv2.COLOR_BGR2GRAY)
    crop_img = img[y:y + h, x:x + w]

    # Update the data
    heartbeat_values = heartbeat_values[1:] + [np.average(crop_img)]
    heartbeat_times = heartbeat_times[1:] + [time.time()]

    # Draw matplotlib graph to numpy array
    ax.plot(heartbeat_times, heartbeat_values)
    fig.canvas.draw()
    plot_img_np = np.fromstring(fig.canvas.tostring_rgb(), dtype=np.uint8, sep='')
    plot_img_np = plot_img_np.reshape(fig.canvas.get_width_height()[::-1] + (3,))
    plt.cla()

    # Display the frames
    cv2.imshow('Crop', crop_img)
    cv2.imshow('Graph', plot_img_np)
    if cv2.waitKey(1) & 0xFF == ord('q'):
        break

cap.release()
cv2.destroyAllWindows()
和往常一样,所有成功的实验